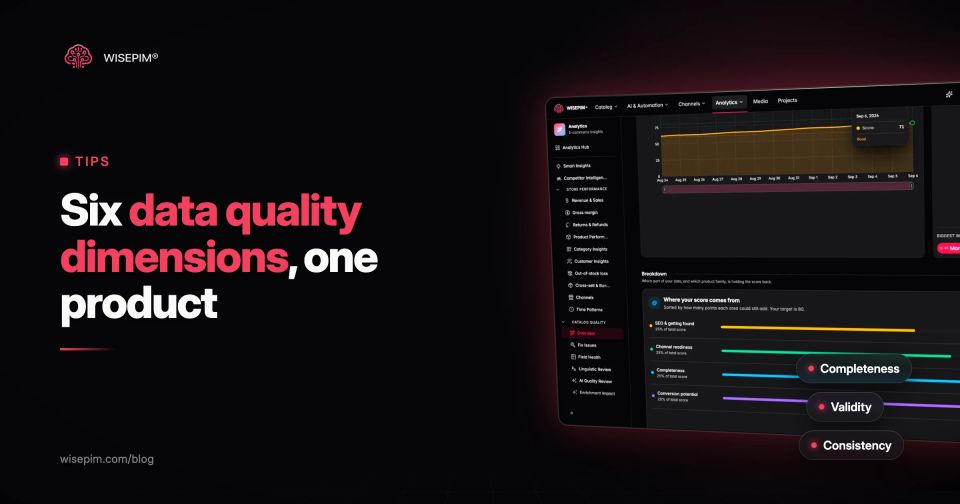
Data quality dimensions are the measurable properties you use to decide whether data is fit for its job. The six most widely used are accuracy, completeness, consistency, timeliness, validity and uniqueness. That is the set defined by DAMA UK and adopted in the UK Government Data Quality Framework, and it is the set most data teams start with.
For a product catalog, each dimension turns into a concrete check on real fields. Completeness asks whether color and size are filled. Validity asks whether the GTIN passes its check digit. Consistency asks whether the price in your Google feed matches the price on the product page. This post walks through all six with one running product example, shows how to measure each one, maps the most common data quality issues to the dimension they break, and ends with a weighted scorecard you can copy.
Why bother: in Salsify's 2024 consumer research, 42% of shoppers said bad product titles and descriptions are enough to make them abandon a cart, and Syndigo's 2025 report found 44% had abandoned a purchase because of insufficient product information. Both firms sell product content software, so read the numbers as vendor research, but the direction matches what any catalog manager sees in returns and support tickets.
Where the six dimensions come from
There is no single official list. According to IBM, the idea was formalized in 1996 by Richard Wang and Diane Strong, whose paper identified 15 dimensions from the point of view of data consumers. DAMA UK later narrowed the field to six core dimensions in a 2013 working group paper, and the UK government reused those six in its 2020 framework.
The international standard ISO/IEC 25012 takes a broader view: 15 characteristics, split into inherent ones (such as accuracy, completeness and consistency) and system-dependent ones that depend on the software holding the data. That level of detail suits a data warehouse team. For a catalog of 500 to 50,000 SKUs, the six core dimensions cover almost everything that breaks a listing, and they are easy to explain to a supplier or a marketplace account manager.
The running example: one pack of socks
Every dimension below uses the same record, taken from the kind of supplier import most webshops receive. It is a 3-pack of merino crew socks, size 43 to 46, sold on your own store and through a Google Merchant Center feed:
- sku: MER-CREW-3P-4346
- title: Merino Crew Socks 3-Pack Navy 43-46
- brand: empty
- gtin: 13 digits, but the last digit does not match the check digit
- color: "navy blue" on the webshop, "Navy" in the feed
- size: 43-46
- pack_size: 1
- material: "N/A"
- description: 18 words copied from the supplier PDF
- price: 24.95 on the product page, 22.95 in the feed
- availability: in_stock, while the warehouse count has been 0 for four days
- duplicate: the same socks exist under supplier SKU 55102 from an older import
Nothing about this record is unusual. Every problem in it maps to exactly one of the six dimensions, which is what makes the dimensions useful: they tell you where the fix belongs.
1. Completeness: are the required fields filled?
Completeness is the degree to which the values you need are present. The important word is need. A field is only required if a channel, a filter or a shopper decision depends on it, so define required fields per category and per channel rather than for the whole catalog.
For apparel, Google's product data specification requires color and size for clothing and shoes targeted at countries including the US, the UK and Germany. A webshop filter on material needs material. A sock product without pack_size cannot be compared on price per pair.
How to measure it: filled required fields divided by required fields, per product, then averaged per category. Our sock record has seven required fields (title, brand, gtin, color, size, material, pack_size). Brand is empty and material holds "N/A", so it scores 5 of 7, or 71%, and that is before you question whether the filled values are any good.
Our data completeness guide goes deeper on choosing required fields per category.
2. Validity: does each value follow the rules?
Validity is the degree to which data is in the format and range expected. It is the easiest dimension to automate, because the rules are written down somewhere: in a channel specification, in your own data model or in a standard.
Product data examples from the Google specification: availability must be one of in_stock, out_of_stock, preorder or backorder. price needs a number and an ISO 4217 currency code, such as 15.00 USD. A GTIN must pass GS1 check digit validation. Colors must not be values like "#fff000" or a single letter.
How to measure it: products that pass all validity rules divided by products checked. Our sock record fails the GTIN rule. It passes the price format and availability value rules, which shows the limit of validity: "in_stock" is a perfectly valid value that happens to be false.
The data validation guide lists the rule types that catch most catalog errors before they reach a channel.
3. Accuracy: does the data match the real product?
Accuracy is the degree to which data matches reality. It is the dimension that hurts most when it fails (returns, complaints, chargebacks) and the hardest to automate, because software cannot see the physical product. You need a reference: the manufacturer spec sheet, a physical sample or a trusted source such as the brand's own feed.
Our record says pack_size: 1. The title, the photo and the packaging say three. The field is filled, so completeness is happy, and 1 is a valid integer, so validity is happy too. Only an accuracy check catches it.
How to measure it: sample. Pick 50 random SKUs per category each quarter, compare five to ten key fields against the reference, and record the share of fields that match. Weight the sample toward bestsellers and toward categories with high return rates.
4. Consistency: does the same fact agree everywhere?
Consistency is the degree to which values representing the same thing do not contradict each other. In a catalog that covers two situations: fields inside one record that disagree, and the same field that differs between systems or channels.
Our sock record fails both ways. Inside the record, the title says 3-Pack while pack_size says 1. Across channels, the color is "navy blue" on the webshop and "Navy" in the feed, and the price is 24.95 on the page and 22.95 in the feed. Google's specification asks you to submit a price that matches your landing page, so that last one is not cosmetic: it is a reason for disapproval.
Consistency also covers vocabulary. If 40 products say "Navy", 12 say "navy blue" and 9 say "Dark Blue", your color filter shows three options for one color. That is what attribute standardization fixes.
How to measure it: for cross-channel checks, the share of products where price, availability and title match between your source and each channel export. For vocabulary, the number of distinct values per attribute compared with the number you would expect.
5. Timeliness: is the data current enough?
Timeliness is the degree to which data reflects the period it describes. Some product fields barely age (material, dimensions, GTIN). Others go stale within hours: price, stock and availability.
Our record shows in_stock four days after the warehouse ran out. Every click on that listing is paid traffic to a product nobody can buy, and every order is a cancellation. On a marketplace, cancellations also count against your seller metrics.
How to measure it: set a maximum age per field group and check the share of products inside it. For example, stock and price must be at most one hour old in every channel, marketing copy must be reviewed at least once a year. The useful number is the lag between a change in the source system and the moment the channel shows it.
6. Uniqueness: does each product exist once?
Uniqueness is the degree to which there is no duplication. In catalogs, duplicates usually arrive through imports: the same product from two suppliers, a re-import with new SKUs after a migration, or a variant created as a separate product.
Our socks exist twice, once as MER-CREW-3P-4346 and once as supplier SKU 55102. Duplicates split reviews and sales history across two pages, compete with each other in search, and on marketplaces that group every seller's offers on one page per GTIN, a second record with a wrong or reused GTIN can put your offer on the wrong page.
How to measure it: group products by GTIN, then by a normalized key of brand plus title plus size, and count the groups with more than one member. Our deduplication guide covers the matching rules in detail.
Two extra dimensions that earn a place in product data
Longer lists add dimensions such as integrity (relationships between records are intact), relevance (the data serves a real decision), accessibility, reliability and lineage (you can trace where a value came from). For product data, two of these earn a place:
- Integrity: every variant points to a parent that exists, every product points to a category that exists, every image URL resolves.
- Lineage: you know whether a value came from the supplier, from a person or from AI enrichment, and when. That matters as soon as you need to explain a wrong value to a customer or a marketplace.
Recurring catalog defects, sorted by the dimension they break
Most catalog problems are one of a dozen recurring issues. Naming the dimension tells you whether the fix is a rule, a sample check, a sync or a cleanup:
Twelve catalog defects and the dimension each one breaks
| Empty required attributes | Material, pack size, compatibility | Completeness |
|---|---|---|
| Placeholder values | "N/A" or "0" | Completeness, hidden as a filled field |
| Wrong GTIN check digit | Or letters in a numeric field | Validity |
| HTML fragments or broken characters | "é" instead of "é" in descriptions | Validity |
| Supplier specs that do not match the product | Wrong weight, wrong pack size | Accuracy |
| Product in the wrong category | Hidden from the right filter | Accuracy |
| Mixed units | cm in one product, mm in the next | Consistency |
| Free-text color and size values | "XL", "Extra Large", "x-large" | Consistency |
| Feed price differs from page price | 24.95 on the page, 22.95 in the feed | Consistency and timeliness |
| Stock shown as available after it ran out | in_stock four days after the warehouse hit 0 | Timeliness |
| The same product imported twice | MER-CREW-3P-4346 and supplier SKU 55102 | Uniqueness |
| Variants pointing to a deleted parent | Parent removed, variants left behind | Integrity |
Notice that the most expensive issues (wrong pack size, wrong category, stale stock) are not the ones a completeness percentage shows. A dashboard that reports only fill rates gives you a false sense of safety.
Weighting the six dimensions into one category score
Six separate percentages are hard to act on. Combine them into one score per category with weights that reflect what costs you money. A starting point for a webshop that also sells through Google Shopping:
Starting weights for a webshop that also sells on Google Shopping
| Completeness | 30% | Share of required fields filled, placeholders counted as empty | 71% | 21.3 |
|---|---|---|---|---|
| Validity | 20% | Share of products passing all format rules | 88% | 17.6 |
| Accuracy | 20% | Share of sampled fields that match the reference | 92% | 18.4 |
| Consistency | 15% | Share of products whose price, availability and title match across channels | 83% | 12.45 |
| Timeliness | 10% | Share of products whose price and stock are inside the maximum age | 95% | 9.5 |
| Uniqueness | 5% | Share of products not in a duplicate group | 97% | 4.85 |
The example column is an illustrative 2,000-SKU apparel category. Its weighted score is 0.30 x 71 + 0.20 x 88 + 0.20 x 92 + 0.15 x 83 + 0.10 x 95 + 0.05 x 97, which comes to 84.1 out of 100.
The single number is for trend lines and for comparing categories. The fix list comes from the lowest dimension: in this example, completeness. Adjust the weights to your business. A marketplace seller with strict cancellation limits should weight timeliness higher; a store with high return rates should weight accuracy higher. The data quality score entry explains the scoring logic in more depth.
Four weeks from first export to automated checks
Four-week rollout for one channel and one category
- 1
Week 1
Scope
Pick one channel and one category that drives revenue. Write down the required fields for that combination and the rules for each one (format, allowed values, units).
- 2
Week 2
Baseline
Export the category and calculate completeness, validity and uniqueness with formulas or a script. Pull 50 random SKUs for an accuracy sample. Compare price and availability between your source and the channel export for consistency and timeliness.
- 3
Week 3
Fix in bulk
Normalize vocabulary first (colors, sizes, units), then fill missing attributes, then merge or delete duplicates. Bulk fixes at the attribute level move the score faster than editing products one by one.
- 4
Week 4
Prevent
Turn the rules into checks that run on every import and every save, and stop failing products from reaching the channel. Re-measure, then extend to the next category.
Week 4 is where most teams stall, because checking data after it is published only tells you what already went wrong. WISEPIM's Quality Guard runs rules on every import, bulk edit, AI run and manual save, scores each product from 0 to 100, and holds back products that fail a Block rule from that channel's export. AI enrichment can then fill the missing attributes and descriptions, with the same rules checking the output.
Measure the dimensions that cost you money
You do not need all 15 ISO characteristics or a data governance program to make progress. Start with the six dimensions, measure them on one category, and let the weakest one decide what you fix first. To see where your own catalog stands, run a few products through the product data quality calculator, or read the data quality guide for the full set of practices.