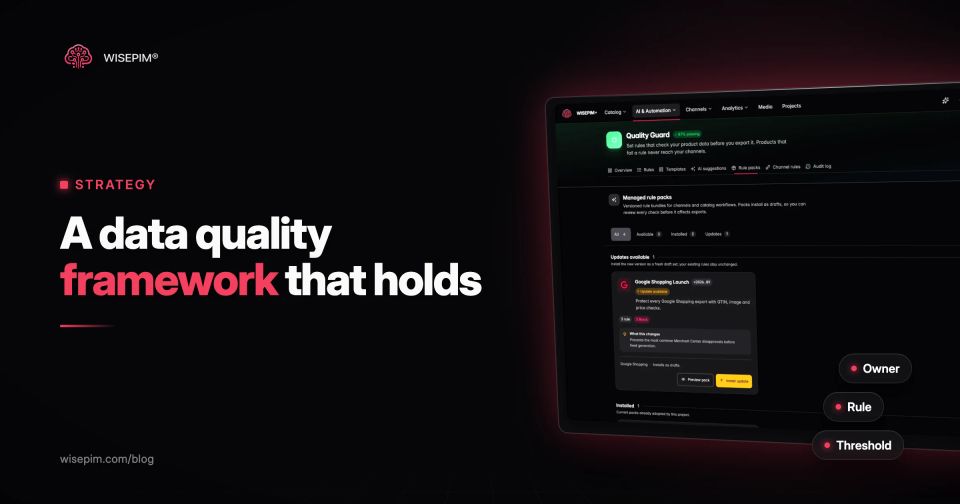
A data quality framework is the set of agreements that keeps data fit for use: which data matters, who owns it, which rules it must pass, where those rules run, what happens when a record fails, and how you report and improve the result. For a product catalog, that means owners per field group, rules per sales channel, checkpoints at import and before export, and a short list of metrics someone reviews every month.
Data quality metrics are the numbers that tell you whether the framework works. Good ones have a formula, a threshold, an owner and a decision attached. This post gives you the seven building blocks of a product data quality framework, 12 metrics with formulas, a worked example and a one-page template. The quality dimensions themselves (completeness, validity, accuracy and the rest) are covered in our post on data quality dimensions, so we refer to them here without explaining them again.
Four terms teams mix up, and what each one is for
These four terms get mixed up, and the confusion is why many quality projects produce a dashboard and nothing else.
- Dimension: a property of good data, such as completeness or consistency. It describes what to look at.
- Metric: a calculation on one dimension or process, such as "share of products with all Kaufland-required attributes filled". It describes how to measure.
- KPI: a metric with a target that leadership tracks, such as "channel readiness for Kaufland at 95% or higher by end of quarter".
- Framework: the people, rules, checkpoints and routines that move the KPIs. Without it, metrics only describe the problem.
Enterprise models such as DAMA-DMBOK are written for data management teams. Public-sector frameworks are a more practical reference for a catalog team, because they are written for people who are not data specialists. The UK Government Data Quality Framework, published in December 2020, rests on five principles: commit to data quality, know your users and their needs, assess quality throughout the data lifecycle, communicate data quality clearly and effectively, and anticipate changes that affect it. It maps quality work onto a lifecycle from planning and collection through use, sharing and archiving. That lifecycle view is the part most e-commerce teams miss: they check data once, at the end, when it is already live.
A second idea worth borrowing comes from Thoughtworks: split requirements into baseline rules that apply to all data (types, formats) and fit-for-purpose rules tied to one use case. In a catalog, the use case is usually the channel. A product can be good enough for your own webshop and still not be good enough for Google Shopping.
The seven building blocks of a product data quality framework
We will use one running example: a hardware retailer with 3,000 SKUs that sells on its own Shopify store, through Google Shopping and on Kaufland. One of its products is an 18V cordless drill, SKU DRL-18V-BL, sold body-only and as a kit with two batteries.
1. Scope: critical data elements per channel
Start by writing down which fields matter for which channel. This list is your data contract. For the drill it looks like this:
- All channels (baseline): title, brand, GTIN, price, stock, main image, category, voltage, battery included (yes/no).
- Google Shopping: everything above plus a valid GTIN, a landing page price that matches the feed and a Google product category.
- Kaufland: everything above plus the marketplace category attributes, such as chuck size, maximum torque and number of batteries.
- Own webshop: everything above plus a description, at least four images and the filter attributes your collection pages use.
Keep the list short. A framework that tries to govern 300 fields governs none of them. Pick the fields that block a listing, drive a filter or cause a return.
2. Ownership: one owner per field group
Every critical field needs one accountable owner, a person or role, not a department. A workable split for a mid-size retailer:
- Identifiers and logistics (GTIN, MPN, weight, dimensions): purchasing or the supplier manager, because the values come from suppliers.
- Price and stock: the ERP or operations owner. Nobody edits these by hand in the PIM.
- Technical attributes (voltage, torque, chuck size): the category manager.
- Marketing content (title, description, images): the content or e-commerce team.
- Channel mapping (categories, channel-specific attributes): the marketplace or channel manager.
Our data governance guide goes deeper into roles such as data owner and data steward. The point for the framework is simple: when a metric goes red, there must be exactly one name next to it.
3. Rules: baseline rules and channel rules, each with a severity
Turn the data contract into rules a system can check. Write each rule with a condition, a scope and a severity:
Five drill rules with their scope and severity
| GTIN must pass the GS1 check digit | All channels | Block | The product does not go out. |
|---|---|---|---|
| Number of batteries required when category is Cordless drills | Kaufland | Block | The product does not go out on Kaufland. |
| Title between 30 and 150 characters | Google Shopping | Warn | The product goes out, the issue lands in a queue. |
| Description at least 80 words | Own webshop | Warn | The product goes out, the issue lands in a queue. |
| Voltage must be one of 12V, 18V, 36V | All channels | Block | Free text such as "18 volt" fails and the product does not go out. |
Severity is the most useful decision you make in the whole framework. If every rule only warns, nothing stops bad data and the warning list grows until people stop reading it. If every rule blocks, half the catalog stops exporting. Block what a channel would reject or what causes returns; warn on the rest. The data validation guide has more rule patterns.
4. Checkpoints: where the rules run
Map the rules to the moments data changes. These are the product data version of the lifecycle stages in the GOV.UK framework:
- At import: supplier files and ERP syncs. Catch format errors before they spread to 3,000 products.
- On edit: manual saves, bulk edits and AI-generated content. AI output needs the same rules as typed data.
- Before export: run the channel rules while the feed is built, so a failing product is held back instead of rejected.
- After publish: read channel feedback. Google Merchant Center lists item-level product issues on its Products page and lets you download the affected items, which is a direct measure of what slipped through.
5. Metrics and thresholds
Choose a small set of metrics, each with a floor (below this, act now) and a target (where you want to be). The next section lists 12 candidates. Most teams should report five to eight.
6. Remediation: a queue, triage and root causes
Failing products need somewhere to go. A remediation queue lists the product, the rule it failed, the channel and the owner. Triage it weekly in this order: blocked products with stock first, then blocked products without stock, then warnings on best sellers.
Fix the source, not the symptom. If 140 drills from one supplier arrive with torque in inch-pounds, converting them by hand every month is not a fix. Ask the supplier for newton meters, or add a conversion rule at import. Tag every issue with a root cause (supplier, import mapping, manual entry, AI output, channel change) so you can see which source produces most of the work.
7. Reporting and review cadence
Decide who sees which numbers and how often. A rhythm that works for most catalog teams:
- Daily: blocked products with stock, by channel. The owner of the queue looks at it.
- Weekly: new issues by root cause, and the age of the oldest open issue.
- Monthly: the full metric set with trends, reviewed by the e-commerce manager and the field-group owners. Rules get added, changed or retired here.
- Quarterly: KPIs against targets, plus a check that the data contract still matches the channels you sell on.
12 data quality metrics in three layers: state, process, outcome
Group your metrics in three layers. State metrics describe the data today. Process metrics describe how fast the team catches and fixes problems. Outcome metrics connect quality to money. A framework with only state metrics cannot tell you whether the work pays off.
State metrics: what the data looks like
- Channel readiness rate: products that pass all Block rules for a channel / active products assigned to that channel. Report it per channel, never averaged across channels.
- Rule pass rate: rule checks passed / rule checks run, per rule. The rules with the lowest pass rate are your fix list.
- Critical field fill rate: products with a field filled with a valid value / products where the field is required. Count placeholders such as "N/A" or "0" as empty.
- Duplicate rate: products in a duplicate group / active products. See the deduplication guide for matching rules.
- Sync lag: median time between a price or stock change in the source and the moment the channel shows it. Measure it on a sample of 20 changes a week.
Process metrics: how well the framework catches and fixes issues
- First-time-right rate at import: products that pass all baseline rules on arrival / products imported. Report it per supplier; it is the best number to bring to a supplier conversation.
- Mean time to fix: average time between a rule failure and the passing re-check, for Block issues. Long fix times usually mean the issue has no owner.
- Backlog age: age of the oldest open Block issue and the number of issues older than 14 days.
- Reopen rate: issues that fail again within 30 days of being fixed / issues fixed. A high reopen rate means you fixed the symptom and the next import overwrote it.
Outcome metrics: what bad data costs
- Channel rejection rate: products with an item-level issue in the channel / products sent. For Google Shopping, take the count from the product issues view in Merchant Center.
- Content-related return rate: returns with a reason such as "not as described" or "wrong size" / orders, per category. Shoppers do act on this: in Salsify's 2025 consumer research, 71% said they had returned items over inaccurate descriptions.
- Pre-sale questions per 100 products: customer service tickets and marketplace messages asking for product facts that should have been on the page, such as "Is the battery included?"
Our dictionary entry on product data quality metrics lists further variants. Resist adding them all. Each metric you report needs an owner who will act on it.
A monthly review of 520 power tools on Kaufland
Here is an illustrative monthly review for the retailer's 520 power tools, of which 410 are listed on Kaufland. The numbers are made up but realistic in shape:
Monthly review: 520 power tools, 410 on Kaufland
| Channel readiness, Kaufland | 80.0% (328 of 410 pass all Block rules) | Floor 85%, target 95% | Red. |
|---|---|---|---|
| Rule pass rate, "Number of batteries required" | 80.0% (1,312 of 1,640 checks) | This one rule explains most of the readiness gap. | |
| First-time-right at import | Supplier A 94%, supplier B 61% | Supplier B sends battery counts in the description text, not in a field. | |
| Mean time to fix, Block issues | 9 days | Target 3 days | |
| Reopen rate | 22% | The weekly supplier B import overwrites manual fixes. | |
| Content-related return rate | 2.4% of power tool orders | Mostly "battery not included" on body-only drills. |
Read together, the numbers point to a single root cause. Supplier B's battery information sits in free text, the import does not map it to the attribute, people fix it by hand, the next import overwrites the fix, and shoppers who miss the detail return the drill. The action is not "improve data quality". It is: map supplier B's battery count to the attribute at import, protect manually fixed fields from being overwritten, and add "Body only, battery not included" to the title of body-only variants. Next month, readiness, reopen rate and returns should all move.
Setting floors and targets from your own baseline
Do not copy targets from another company. Measure a baseline for one month first, then set two lines per metric:
- Floor: the level below which the owner acts within the week. Set it a little above today's baseline so it triggers on real decline, not noise.
- Target: the level you commit to for the quarter. Base it on what the channel requires; a marketplace that rejects incomplete listings needs readiness close to 100% for products you want to sell there.
- Direction: for lag, fix time, backlog age and return rate, lower is better. Say so on the report, or someone will celebrate a rising line.
Raise targets only when a metric has held above target for two review cycles. Moving the bar every month makes the trend line meaningless.
Seven framework choices that end in a dashboard and no fixes
- Measuring only completeness. A filled field can still be wrong. Pair fill rates with rule pass rates and at least one outcome metric.
- One global quality score as the only number. A single score is fine for a trend line, but owners need the rule and field that failed.
- Fixing data in the channel. Editing a title directly in Kaufland or Shopify fixes one place and is lost at the next sync. Fix it at the source.
- Rules without severities. Fifty warnings per product teach people to ignore warnings.
- No checkpoint before export. Checking after publish means the channel, or the customer, finds the error first.
- AI output treated as trusted. Generated descriptions and attributes need the same rules and the same review as data typed by a person.
- A framework document nobody opens. If the rules live in a PDF and not in the system that holds the data, they will drift apart within a quarter.
One page per channel: a data quality framework template
Fill in one page per channel. If a line stays empty, that is the gap to close first.
- Channel and scope: for example "Kaufland, categories Power tools and Garden".
- Critical fields: the 10 to 20 fields that block a listing, drive a filter or cause a return.
- Owner per field group: a name, not a team.
- Rules: condition, scope, severity (Block or Warn) and the reason the rule exists.
- Checkpoints: import, edit, before export, after publish. Note which system runs the check at each one.
- Metrics: five to eight, each with formula, floor, target and owner.
- Remediation: where failing products go, triage order, maximum fix time for Block issues.
- Review cadence: daily, weekly, monthly and quarterly, with attendees.
- Change log: date, rule changed, reason. It saves you from re-arguing the same decisions.
Running the framework in a PIM
Spreadsheets can hold the template, but they cannot run rules at import or hold a product back from an export. That is where a PIM earns its place. In WISEPIM, Quality Guard holds the rules: you set a Block, Warn or Skip severity per rule and a separate rule set per channel, and the rules run on every import, bulk edit, AI run and manual save. Products that fail a Block rule wait in a quarantine queue with the rule and channel that stopped them, so the remediation queue from building block 6 exists without extra work.
For the monthly review, the data quality report tracks a 0 to 100 score over time and ranks fields by fill rate, which covers several state metrics from the list above. Outcome metrics such as returns still come from your store or marketplace data, so keep those in the same review.
To see where your own catalog starts, run a sample through the free product data quality calculator, then write the first page of the template for the channel that brings in the most revenue.