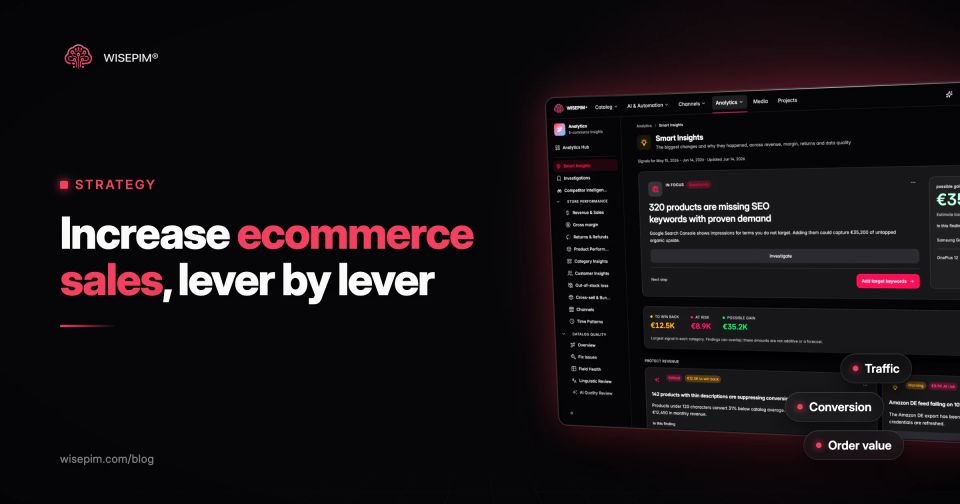
Ecommerce revenue is sessions × conversion rate × average order value, and over a year, how often customers come back. To increase ecommerce sales, find which of those factors is weakest, then fix the leaks on traffic you already have (product pages, stock, checkout costs, search), raise order value, bring buyers back, and only then spend more on traffic or open new channels.
The order matters more than the tactics. A fix to a product page or a checkout step improves every visit that follows, including the paid and new-channel traffic you add later. Buying traffic first sends more people into the same leaks. This post ranks twelve growth levers by that logic and links to deeper guides instead of repeating them. For the metric definitions, see our earlier post on ecommerce KPIs.
The revenue formula and how to spot the weak factor
Shopify frames sales growth around the same small set of levers: traffic, conversion rate and customer value, and notes that the right strategy depends on the strengths and weaknesses of your own funnel (Shopify). Read your last 90 days against these patterns:
Which revenue factor is weak, and where to start
| Plenty of sessions, low conversion rate | The leak is on the site | 1 to 4 |
|---|---|---|
| Healthy conversion, low order value | Shoppers buy one item and leave | 5 to 7 |
| Good first orders, few second orders | Retention | 8 and 9 |
| Every ratio is fine, the store is just small | Traffic and reach now pay off | 10 to 12 |
Put your own numbers into the conversion rate calculator and the average order value calculator before you pick a lever. Compare against your own history per channel and device, not against an industry average that mixes furniture with phone cases.
Worked example: why a 10% gain is not the same 10% everywhere
Take an illustrative outdoor gear store with 1,400 SKUs. These figures are an example, not a benchmark:
- Sessions: 60,000 a month
- Conversion rate: 1.5%, so 900 orders
- Average order value: €68
- Monthly revenue: 900 × €68 = €61,200
Raise any one factor by 10% and revenue rises to about €67,300. On paper the three routes are equal. In practice they are not. Buying 6,000 extra sessions costs ad money every month and stops when the budget stops. Moving conversion from 1.5% to 1.65% by fixing the 50 product pages that get most of the traffic costs a few weeks of work and keeps paying. And because the factors multiply, the conversion fix also makes every later euro of ad spend return more. That is the reason the levers below start on the site and end with traffic.
Twelve growth levers, from quick fixes to new markets
1. Fix the product pages that already get the traffic
Sort products by sessions over the last 90 days and open the top 50. For each one, check what a shopper needs to decide: a title that names the product type and key attribute, a description that states specifications, size or compatibility, more than one image, reviews near the price, and a price and delivery promise above the fold. In Salsify's 2024 consumer research, 42% of shoppers said bad product titles and descriptions are enough to abandon a cart (Salsify, 2024).
Then look for pages with traffic but low add-to-cart compared with their category. Those are the pages where missing information costs the most. Our field-by-field guide to product page SEO covers how to rebuild titles and descriptions from attributes.
2. Stop losing sales on out-of-stock and discontinued products
Sold-out products often keep their rankings and ad traffic. A shopper who lands on one and finds no date, no alternative and no notify button is lost. For temporary stockouts, show the expected date and a back-in-stock signup. For discontinued items, link the successor or the nearest alternative. Keep ads and feeds from promoting products you cannot ship. Once a month, list the sessions that landed on unavailable products. In catalogs with seasonal ranges, that list is often longer than the team expects.
3. Put shipping costs on the product page
Baymard Institute's checkout research puts the average documented cart abandonment rate at 70.22%. Among shoppers who abandoned for a reason other than browsing, 40% cited extra costs that were too high, 18% a required account and 17% a checkout that was too long or complicated (Baymard Institute). Show shipping costs on the product page, allow guest checkout, and cut fields that the order does not need.
Top reasons shoppers abandon checkout
| Category | Share of shoppers who abandoned |
|---|---|
| Extra costs too high | 40% |
| Account required | 18% |
| Checkout too long or complicated | 17% |
4. Make search and filters return the right products
A shopper who types "waterproof hiking boots size 44" and gets zero results, or filters by size and sees half the catalog vanish, does not convert. Both failures usually trace back to attributes: sizes stored in the title, colors spelled three ways, waterproofing only mentioned in the description. Fill the attributes that filters read and keep the values consistent. Our guide to ecommerce site search lists the fields per query type.
5. Recommend items that are actually bought together
Recommendations raise order value when they are relevant: a sleeping bag liner with the sleeping bag, not a random bestseller. Base them on pairs that appear together in your own order data and on compatible attributes. The methods and placements are in our post on product recommendations.
6. Bundle complementary products
A tent, footprint and repair kit sold as a set lifts order value and makes the choice easier. Bundles need their own SKU, stock logic and feed data, and a price that still leaves margin. See product bundling for pricing and setup per platform.
7. Set the free shipping threshold from your own order data
A threshold set just above your current average order value nudges shoppers to add one more item. Set it too high and it is ignored; too low and it gives away margin on orders that would have happened anyway. Check the distribution of order values, not only the average, and make sure there are products priced to close the gap. In the example store, with an average order of €68, a threshold of €75 is within reach of many baskets, as long as the catalog has useful add-ons between €7 and €15: socks, gas canisters, repair patches. Tag those products so the cart can suggest them.
8. Bring first-time buyers back with post-purchase email
Abandoned cart reminders, an order follow-up with care or usage tips, a review request, and replenishment reminders for consumables are the flows to set up first. They run on product data too: a replenishment email needs a usage period per product, and a care email needs the material. Segment by what was bought: someone who bought a stove needs fuel, someone who bought leather boots needs care products. That only works when product type and compatible accessories are fields, not phrases in a description.
9. Cut returns caused by wrong or missing information
A return reverses a sale and adds handling costs. Syndigo's 2025 research found that 44% of shoppers abandoned a purchase because of insufficient product information (Syndigo, 2025), and missing details also drive returns after purchase. Read return reasons per product, fix the size, material and compatibility fields behind the top reasons, and track the effect with the return rate per SKU.
10. Earn organic traffic on category and product pages
Once pages convert, more organic traffic is worth more. Focus on category pages for broad queries and product pages for exact model and attribute searches. Unique titles, specification-rich descriptions and valid structured data do most of the work. Prioritize with Search Console data: pages with many impressions and a low click-through rate need better titles, and pages on page two for buying queries need better content and internal links. For broad queries, a category page with a short, useful introduction and clean filter URLs is usually the better target than a single product.
11. Feed Google Shopping and marketplaces complete product data
Shopping ads, free listings and marketplaces match products on structured fields: GTIN, brand, color, size, material, category. Google notes that pages with Product markup can be eligible for merchant listing experiences such as the shopping knowledge panel, Google Images and popular product results (Google Search Central). Thin feeds get disapproved or shown for the wrong queries.
12. Sell in new markets and languages
A new country adds demand without competing for the same shoppers. It only works when the catalog is translated, not just the theme: in CSA Research's survey, 76% of online shoppers preferred to buy products with information in their own language (CSA Research, 2020). Prices, VAT, payment methods and shipping need the same care.
Attributing a sales change to the lever that caused it
Most growth work fails quietly because nobody can say whether it worked. Three habits prevent that:
- One metric per lever. Product page fixes: add-to-cart rate on the changed pages. Checkout changes: checkout completion. Recommendations: attach rate. Returns: return rate per SKU.
- A control group. Change 50 product pages and compare them with 50 similar pages you did not touch, over the same weeks. That removes most of the seasonal noise.
- A fixed window. Decide before the change how long you will measure (four to six weeks is common for product page work) and do not stack a second change on the same pages in that window.
The twelve levers spread over one quarter
Twelve growth levers over one quarter
- 1
Weeks 1 and 2
Find the weakest factor
Pull 90 days of sessions, conversion and order value per channel and device. Pick the weakest factor. List the top 50 product pages by sessions.
- 2
Weeks 3 to 6
Levers 1 to 4: close the leaks
Fix the top product pages, handle out-of-stock pages, show shipping costs early, clean the attributes your filters use.
- 3
Weeks 7 to 9
Levers 5 to 7: raise order value
Add recommendations from order pairs, launch two or three bundles, test a shipping threshold.
- 4
Weeks 10 to 12
Levers 8 and 9: bring buyers back
Set up post-purchase and replenishment flows, fix the fields behind the top return reasons.
- 5
Week 13
Measure and decide
Compare each change with its control group, then decide whether to fund traffic, feeds or a new market next quarter.
Five growth tactics that cost more than they return
- Permanent discounting. A sitewide code that never ends trains shoppers to wait and lowers margin on orders that would have happened anyway.
- Buying traffic onto broken pages. Paid traffic to product pages with one image and a supplier description pays for visits that cannot convert.
- Adding channels with thin data. A marketplace or feed launched with missing GTINs and attributes produces disapprovals and returns, not sales.
- Upsells that ignore the cart. Showing the bestseller in every widget looks busy and lowers trust in the next recommendation.
- Changing ten things at once. When everything changes in the same week, you cannot tell which change worked, so you cannot repeat it.
Spotting top sellers with weak product data
Levers 1, 4, 9 and 11 all come back to the same records: titles, descriptions, attributes, images and identifiers. In WISEPIM, Quality Guard checks those fields with rules (a GTIN required before sync, a minimum description length per category, a main image present) and keeps products that fail a blocking rule away from your channels. The Product Performance report puts product revenue and orders from your connected store, plus Google Analytics 4 data when you connect it, next to quality scores, so you can start with the products that sell and have the weakest data, then fill the gaps with AI enrichment.