Returns data
Ecommerce Return Rate Statistics 2026
How often online orders come back, by industry and by cause. Every third-party figure names its publisher and links to the report; every industry rate links to its own statistic and citation.
Key return rate statistics
Quotable figures from published research. Each one has its own link and a ready-made citation.
17.6% of merchandise bought online in the US in 2023 was returned.
Source: NRF and Appriss Retail, Consumer Returns in the Retail Industry 2023 (2023).
US retailers expected 16.9% of their total 2024 sales to be returned.
Source: NRF and Happy Returns, 2024 Consumer Returns in the Retail Industry (2024).
US apparel sellers report that 24.4% of online apparel orders are returned.
Source: Coresight Research, The True Cost of Apparel Returns (2023).
Shopify merchants using Loop saw 14.5% of apparel sales value returned in 2024.
Source: Loop Returns, Winter 2024 Benchmark Report (2024).
Size or fit causes about 70% of apparel returns.
Source: Coresight Research (sponsored by Alvanon), Shifting the Size and Fit Paradigm (2026).
71% of shoppers have returned an item because its description was inaccurate.
Source: Salsify, 2025 Consumer Research (2025).
45% of shoppers have returned an online purchase because of incorrect or misleading product information.
Source: Salsify, 2026 Consumer Research (2026).
About 60% of shoppers have returned a product because of an inaccurate or misleading description.
Source: Akeneo, 2025 Consumer Returns Report (2025).
About a third of Zalando's returns are size-related, and size advice cut those returns by 10%.
Source: Zalando, How Zalando leverages technology to help customers find the right size.
83% of desktop and 87% of mobile apparel sites lack sufficient sizing information.
Source: Baymard Institute, Apparel size information (2022).
Vendor research: Salsify and Akeneo sell PIM software, like WISEPIM.
Average ecommerce return rate by industry
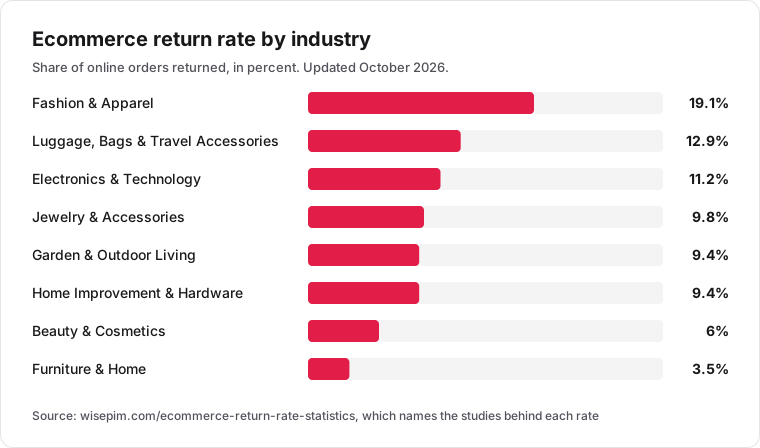
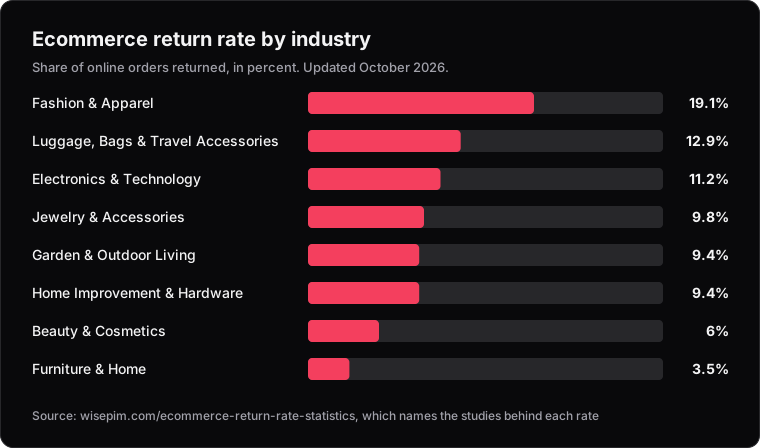
Return rates for 8 e-commerce categories, from Furniture & Home (3.5%) to Fashion & Apparel (19.1%). Each rate links to its statistic and citation on the industry page.
| Industry | Return rate | Source |
|---|---|---|
| Fashion & Apparel | 19.1% | Median of 3 published sources: Coresight Research (Mar 2022 – Mar 2023); ECDB; Loop Returns (Jan 2024 – Oct 2024) |
| Luggage, Bags & Travel Accessories | 12.9% | Source: ECDB |
| Electronics & Technology | 11.2% | Mean of 2 published sources: ECDB; Loop Returns (Jan 2024 – Oct 2024) |
| Jewelry & Accessories | 9.8% | Source: Loop Returns (Jan 2024 – Oct 2024) |
| Garden & Outdoor Living | 9.4% | Source: ECDB |
| Home Improvement & Hardware | 9.4% | Source: ECDB |
| Beauty & Cosmetics | 6% | Mean of 2 published sources: ECDB (2025); Loop Returns (Jan 2024 – Oct 2024) |
| Furniture & Home | 3.5% | Mean of 2 published sources: ECDB; Loop Returns (Jan 2024 – Oct 2024) |
Each rate is the median or mean of the published studies next to it, or a single named study. Industries no study covers are left out. Studies count returns differently (share of orders or of sales value), so compare them with care.
Share this chart
Download the chart, or embed it in your article with a credit link back to this page.
Embed this chart
Paste this HTML into your article. The image links back to the source page.
<figure>
  <a href="https://wisepim.com/ecommerce-return-rate-statistics"><img src="https://wisepim.com/ecommerce-return-rate-statistics/charts/return-rates.svg" alt="Bar chart of ecommerce return rates for 16 industries" width="760" loading="lazy" /></a>
  <figcaption>Source: wisepim.com <a href="https://wisepim.com/ecommerce-return-rate-statistics">WISEPIM, Ecommerce Return Rate Statistics 2026: Rates by Industry</a></figcaption>
</figure>Methodology and sources
WISEPIM checked each third-party figure against its publisher on October 17, 2026. NRF figures measure returned merchandise as a share of US sales by value; the industry rates measure returned orders and come from WISEPIM's industry benchmarks.
Sources
- NRF and Appriss Retail, Consumer Returns in the Retail Industry 2023 (2023)
- NRF and Happy Returns, 2024 Consumer Returns in the Retail Industry (2024)
- Coresight Research, The True Cost of Apparel Returns (2023)
- Loop Returns, Winter 2024 Benchmark Report (2024)
- Coresight Research (sponsored by Alvanon), Shifting the Size and Fit Paradigm (2026)
- Salsify, 2025 Consumer Research (2025)
- Salsify, 2026 Consumer Research (2026)
- Akeneo, 2025 Consumer Returns Report (2025)
- Zalando, How Zalando leverages technology to help customers find the right size
- Baymard Institute, Apparel size information (2022)