A product comparison table puts two to five products side by side, usually with products as columns and attributes as rows, so a shopper can weigh specifications without opening every product page. It belongs on category pages, product pages and buying guides for products people choose on several measurable attributes at once: laptops, drills, e-bikes, coffee machines, mattresses.
Usability research agrees on the layout rules. Show at most five products (often only two on a phone), group the rows, keep the product names visible while the shopper scrolls, and let them hide rows where every product has the same value (Nielsen Norman Group, Baymard Institute). The rule that breaks most tables is a data rule, though: every cell needs a value, in the same unit and format, for every product. This guide covers where to place a table, which attributes to compare per category, layout and mobile patterns, and the attribute data that has to exist before any of it works.
Three places a comparison table earns its space
Comparison tables come in two kinds. A static table compares products you picked in advance; a dynamic one lets shoppers tick a Compare box on the product list and build their own. Nielsen Norman Group's 2024 article by Kate Moran and Taylor Dykes recommends static tables for small sets and dynamic ones for large catalogs, and notes that most dynamic tables accept only three or four items (NN/g).
- Category pages: a Compare checkbox on each product card and a sticky compare bar that opens the table. This is the dynamic version, useful in categories with dozens of similar products, such as cordless drills or robot vacuums.
- Product pages: a short "compare with similar items" block under the specifications, with the current product in the first column and two or three alternatives next to it. It keeps shoppers on your site when they are unsure between models; the product detail page guide covers where it fits among the other sections.
- Buying guides and range pages: a static table of a product line (entry, mid and top model) that explains what the extra money buys. Here you choose the rows and can add a short verdict per column.
Purchases where comparing helps, and where it gets in the way
NN/g ties comparison tables to compensatory decisions: the shopper trades attributes against each other, such as more torque against more weight, or a bigger battery against a higher price. Those decisions are what tables serve best. The same article advises against tables when the items are not mutually exclusive, when they are cheap and simple, or when they are hard to compare on facts; aesthetic purchases like clothing and furniture usually do not need one (NN/g).
A quick test: if your filters for a category are mostly numbers and yes/no features (wattage, capacity, dimensions, "dishwasher safe"), a table will help. If they are mostly style, color and pattern, spend the effort on images and fit information instead.
Comparison attributes for eight product categories
Comparison rows should be the attributes buyers trade off, not every field you happen to have. NN/g warns specifically against dumping all available metadata into the table. These are reasonable starting rows per category, with the unit or value format each one needs:
Comparison rows by category, with units and row groups
| Laptops | Screen size, processor, RAM, storage, weight, battery life | inch, model name, GB, GB, kg, hours | Performance, display, portability |
|---|---|---|---|
| Cordless drills | Voltage, max torque, chuck size, weight with battery, brushless motor | V, Nm, mm, kg, yes/no | Power, handling, battery |
| Robot vacuums | Suction power, run time, dustbin volume, mopping, noise level | Pa, minutes, ml, yes/no, dB | Cleaning, battery, convenience |
| E-bikes | Motor position, motor torque, battery capacity, frame sizes, weight | hub/mid list, Nm, Wh, cm, kg | Motor, battery, fit |
| Mattresses | Firmness, height, core material, removable cover, trial period | 1 to 10 scale, cm, controlled list, yes/no, nights | Comfort, materials, service |
| Coffee machines | Machine type, pump pressure, water tank, milk system, built-in grinder | controlled list, bar, liters, controlled list, yes/no | Brewing, capacity, features |
| Running shoes | Heel-to-toe drop, weight, cushioning level, surface | mm, g, controlled list, road/trail list | Fit and feel, use |
| Wall paint | Coverage, finish, drying time, can size, interior or exterior | m2 per liter, controlled list, hours, liters, list | Application, result |
Two patterns repeat across the table. First, half the rows are numbers with a unit, and those sort and compare well only when the unit is identical for every product. Second, the rest are controlled lists or yes/no values, and those stay comparable only when everyone writes "mid-drive" the same way. Both are attribute modeling questions before they are design questions; the power of product attributes covers that modeling in more depth.
An example comparison table built from attribute data
Here is a worked example: three illustrative 18 V cordless drills from one fictional range, compared on the attributes from the table above. The block below is sortable, so the products are rows here; on a storefront you would usually turn it so products are columns.
Illustrative comparison: three 18 V cordless drills
| Compact drill | 18 | 40 | 10 | 1.4 | 2.0 | No | 89 |
|---|---|---|---|---|---|---|---|
| Brushless drill | 18 | 60 | 13 | 1.6 | 2.0 | Yes | 129 |
| Heavy-duty hammer drill | 18 | 90 | 13 | 2.1 | 4.0 | Yes | 199 |
Several choices make this table work, and each one is a data decision:
- Units sit in the column header, not in the cells. Cells hold plain numbers, so sorting by torque puts 40, 60 and 90 in order. A cell reading "60Nm" next to one reading "60 Nm max." sorts as text.
- One definition per attribute. "Weight with battery" is a different attribute from "weight (bare tool)". Suppliers mix them, and a table that mixes them makes the compact drill look heavier or lighter than it is.
- Booleans are Yes or No, never blank. A blank cell in the brushless row would read as "no" to some shoppers and "unknown" to others.
- Identical rows are information too, but not in the default view. All three are 18 V, which matters for battery compatibility. Show it in the full table and hide it when the shopper switches to differences only.
Layout rules from Baymard and Nielsen Norman Group testing
Baymard's article on comparison tools by Edward Scott (October 2022) lists four improvements from its usability testing: let users remove attributes that are identical across products, group attributes into categories, keep the column headings visible while scrolling, and style rows with dividing lines or alternating shading (Baymard). Of the ways to order attributes, grouping them into categories performed best with test participants. NN/g adds a few more rules:
- Products as columns, attributes as rows, with attribute labels on the left and product names above. This is the convention shoppers expect.
- Five products at most. Bigger sets need filters first, so shoppers narrow the list before comparing.
- Sticky product headers with the name, a thumbnail and the price, so nobody scrolls back up to check which column is which. Baymard found this removes the problem entirely.
- A differences-only switch, such as the Highlight Differences toggle NN/g shows on Best Buy. Where you cannot hide rows, highlight the differing cells instead.
- Short cell text, preferably no full sentences, with consistent alignment. Numbers right-aligned or centered, text left-aligned.
- Explain jargon in place: a tooltip on "brushless motor" or "Wh" that says what it means for the buyer.
- An at-a-glance version with five or six key rows, plus a link or toggle to the full specification table.
Comparison tables on a phone screen
NN/g notes that you may need to cut the table to two products on a phone, so the mobile table needs its own pattern (NN/g). The common one is a fixed first column with attribute labels, two product columns, and a product header that stays at the top while the shopper scrolls down the rows. Let the shopper swap which two products are shown rather than forcing a horizontal scroll through four columns.
If a true side-by-side view does not fit, NN/g suggests turning products into tabs, accepting that comparing gets harder. Do not apply the phone limit to desktop: a desktop shopper with room for four products should be able to compare four. And keep the differences-only switch on mobile, where every hidden row saves a scroll.
Units, value formats and empty cells
NN/g calls content the biggest problem with comparison tables: an attribute that is missing for some of the compared products barely belongs in the table at all. In practice the data problems fall into four groups, and each has a fix in the attribute model rather than in the template. The unit of measure guide covers the unit side in detail.
- Mixed units. Three suppliers send battery capacity as "2Ah", "2000 mAh" and "2.0 Ah". Store one number in one unit (2.0, unit Ah) and let the template print the symbol.
- Uncontrolled values. "Mid-drive", "middenmotor", "center motor" and "Mid" are one value. A fixed list of allowed values per attribute, the kind of reference data a catalog should govern, keeps them identical across products and languages.
- Different definitions behind one label. Weight with or without battery, coverage per coat or per can, run time on eco or turbo mode. Write the definition into the attribute name or its help text, and reject supplier values that use the other one.
- Empty cells. Decide what a gap means and print it: "No" when the feature is absent, "Not specified" when the supplier did not say. Never leave a cell blank, and treat a high "Not specified" count as a signal to fill the attribute before showing the row.
Fill rates decide which rows can go into a table at all. Take an illustrative drill category where "max torque" is filled for 96% of products and "noise level" for 38%: the first is a comparison row, the second is a project. Run that check per category before you design the table, because the template cannot fix a missing value.
Structured data for comparison pages: what schema.org offers
Neither Google nor schema.org has a structured data type made for comparison tables. Google's search gallery lists 25 structured data features, such as Product, Review snippet and Breadcrumb, and none of them is for comparisons (Google Search Central, page last updated 16 October 2026). Schema.org has only a generic Table type, "a table on a Web page", which is not one of Google's rich result features. Mark up each product page with Product structured data as usual, and build the comparison itself as a plain HTML table: a table element, a header row with th cells for the products, and th cells with scope="row" for the attribute labels.
That semantic markup helps screen reader users more than any schema would: they hear the attribute and the product for every cell. Avoid rendering the table as a grid of div elements or as an image, and do not paste comparison content into FAQ or review markup to chase rich results.
Where Magento, Shopify, Lightspeed and WooCommerce keep comparable attributes
Every platform stores the rows somewhere; only some render a comparison for you.
- Magento (Adobe Commerce): built-in Product Compare. Each attribute has a Comparable on Storefront setting; set it to Yes to include the attribute in the comparison (Adobe Experience League). The same Storefront Properties hold Use in Layered Navigation for filters.
- Shopify: specifications usually live in metafields, which the theme or an app reads to build a comparison block. Typed metafields (number with a unit, single-line text from a list) keep values comparable; the Shopify metafields guide covers the types.
- Lightspeed eCom (C-Series): specifications, grouped by product type and capped at 50 on Lightspeed's limits page, which the theme displays on the product page.
- WooCommerce: product attributes, global or per product; comparison comes from the theme or a plugin.
The common thread: the platform holds one value per attribute per product, and the comparison is a view on those values. If the values are inconsistent in the shop, the comparison is inconsistent too, whichever app renders it.
Data checks before a comparison table goes live
Feeding comparison tables from a PIM attribute model
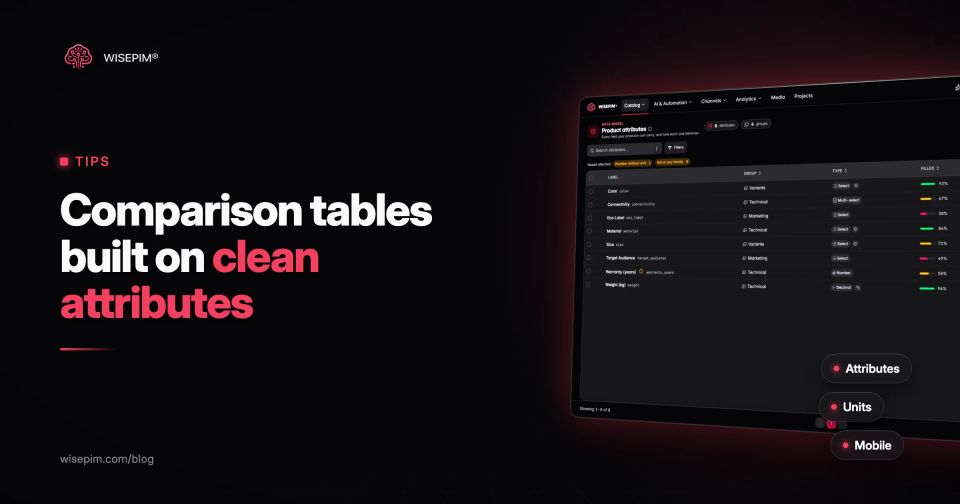
WISEPIM does not render comparison tables on your storefront; your theme, app or platform does that. What it supplies is the structured attribute data behind them. In WISEPIM each attribute has a type (such as number, decimal, boolean, select or multi-select), a group, the categories it applies to, and optionally a unit code set for numbers or an option set of allowed values for selects, as described on the attribute management page. AI enrichment can fill missing attribute values from the product's titles and descriptions, and the attribute list shows fill rates per attribute so you can see which rows are ready.
Those attributes go out through the connections in each platform's own format: metafields on Shopify, attributes on Magento, specifications on Lightspeed eCom. Feed Hub can also publish a schema.org Product JSON-LD feed that lists visible attribute values as additionalProperty, for teams that build comparison pages or other tools on top of a feed. The attribute standardization guide covers cleaning up values that arrived inconsistent.