Finding
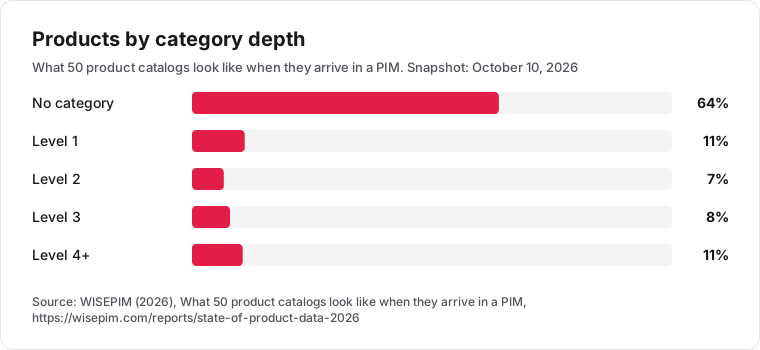
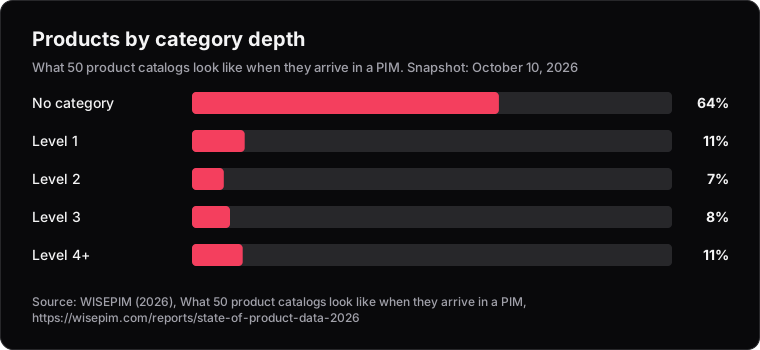
64% of products in the average catalog sit in no category
For about 20,000 products in 50 catalogs, we took the deepest category each product is assigned to, as the data arrived in WISEPIM. Averaged across catalogs, 64% of products are not assigned to any category at all, while 11% sit four or more levels deep in the category tree.
Snapshot: October 10, 2026. Every figure is an aggregate across catalogs, and each catalog counts once.
From the report: What 50 product catalogs look like when they arrive in a PIM
Show the figures
| Bucket | Share |
|---|---|
| No category | 64% |
| Level 1 | 11% |
| Level 2 | 7% |
| Level 3 | 8% |
| Level 4+ | 11% |
Cite this finding
Free to quote with a link to this page.
64% of products in the average catalog sit in no category. WISEPIM (2026), What 50 product catalogs look like when they arrive in a PIM, https://wisepim.com/reports/state-of-product-data-2026/products-without-categories
Embed the chart
Paste this HTML into your article. The chart links back to this page and credits WISEPIM as the source.
<figure>
  <a href="https://wisepim.com/reports/state-of-product-data-2026/products-without-categories"><img src="https://wisepim.com/reports/state-of-product-data-2026/charts/categoryDepth.svg?lang=en&theme=light" alt="Products by category depth. What 50 product catalogs look like when they arrive in a PIM, WISEPIM" width="760" loading="lazy" /></a>
  <figcaption>Source: <a href="https://wisepim.com/reports/state-of-product-data-2026/products-without-categories">WISEPIM, What 50 product catalogs look like when they arrive in a PIM</a></figcaption>
</figure>